Components of Px Framework:
PxChart - the component for displaying and working with charts
The PxChart component is a component of the Px Framework, which enables you to create
attractive 3D and 2D charts for your web applications. The PxChart component can be load
data directly from the PxWebQuery component, or directly from the XML file. The PxChart
contains a wide scale of charts, such as a traditional Bar Graph, Line, Area, Pie, and so on.
For the correct functioning of the PxChart component you need to have the Flash Player installed in your web browser.
If you want to work with the PxChart component, you have to define it in the *. aspx file as follows:
<Prx:PxChart ID="Chart" runat="server">
If you want the PxChart component to be visible in the aspx files, define the "Prx"
prefix related to the assembly of the PxChart component in the header of the file.
Do it as follows:
<%@ Register TagPrefix="Prx" Namespace="PxChart" Assembly="PxChart" %>
Then you can work with the PxChart component in the *. aspx.cs file as follows.
First, load to the PxWebQuery component data from the database, and then link it to
the PxChart component. At first link the PxWebQuery component to the PxChart
component via the PxDataSource property. Then, define through the FieldName and FieldValue
properties of the PxChart component linking of the PxWebQuery component columns to
individual axes, X and Y of the PxChart component. More in the example below:
       Chart.PxDataSource = wquStatistics;

       Chart.FieldName = "name";

       Chart.FieldValue = "count";
Charts description can be defined via the Caption and SubCaption property. More in the example below:
       Chart.Caption = "Statistics of genres ";

       Chart.SubCaption = "A summary of genres for all CD titles ";
Similarly chart type can be defined via the TypeChart property. Individual chart
types are defined in the enumerative type PxChart.enumTypeCharts.
More in the example below:
Chart.TypeChart = PxChart.PxChart.enumTypeCharts.tcColumn3D;
The whole source code of the example that was discussed here, together with
data loading to the PxWebQuery component and linking to the PxChart component
and selecting the chart type, is shown below in the attached list of the source code.
protected void Page_Load(object sender, EventArgs e)
{
if (wquStatistics.Active == false)
{
wquStatistics.ConnectString = AppConst.ConnectString;
wquStatistics.SQLSelect = @"select CdTitul.IdZaner as idzaner,COUNT(*) as count,
Zaner.Name as name from CdTitul, Zaner
where CdTitul.IDZaner=Zaner.IdZaner
group by CdTitul.IDZaner";
wquStatistics.Open();
wquStatistics.AutomaticRefresh = true;
wquStatistics.IntervalQueryRefresh = 30;
wquStatistics.Columns["IdRecNum"].Caption = "Id";
wquStatistics.Columns["Pocet"].Caption = "Count genres";
wquStatistics.Columns["name"].Caption = "Name of genres";
wquStatistics.Columns["idzaner"].Caption = "Count genres II.";
}
Chart.PxDataSource = wquStatistics;
Chart.FieldName = "name";
Chart.FieldValue = "count";
Chart.Caption = "Statistics of genres";
Chart.SubCaption = "A summary of genres for all CD titles";
//Chart.Width = 800;
//Chart.Height = 800;
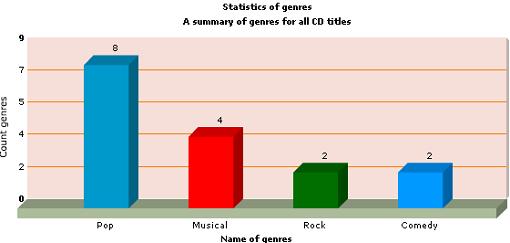
Chart.TypeChart = PxChart.PxChart.enumTypeCharts.tcColumn3D;
Chart.AddHeader("canvasBgColor", "F6DFD9");
Chart.AddHeader("divlinecolor", "F47E00");
}
The AddHeader method, enables to enter to the PxChart component various elements
with the definition of value that can affect form and shape of the output graph.
Description of the parameters of the AddHeader method:
C# syntax:
public void AddHeader(string Tag, string Value)
Description of the parameters:
Tag - enter the tag name to this variable
Value - enter the tag value to this variable
Picture of the resulting graph looks like this, see the image below:
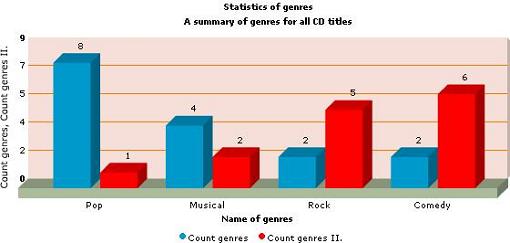
If you want to work with the series chart, i.e. more charts next to each other,
you can do it via the FieldValue property of the PxChart component.
Carry out a so-called overload of the FieldValue property by consequently
entering more column names from the PxWebQuery component, which are separated by a semicolon.
Yet of course you should choose a serial chart in TypeChart property,
for example tcMSColumn3D. Each serial chart starts with the tcMS ... prefix.
More in the example below:
       Chart.PxDataSource = wquStatistics;

       Chart.FieldName = "name";

       Chart.FieldValue = "count;idzaner";

       Chart.TypeChart = PxChart.PxChart.enumTypeCharts.tcMSColumn3D;
Picture of the resulting graph looks like this, see the image below:
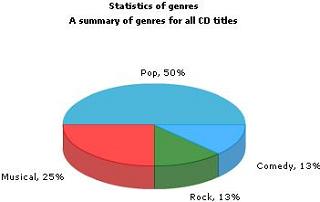
If you want to create a pie-chart, you can do it by entering the "tcPie3D"
the chart type to the TypeChart property. More in the example below:
       Chart.PxDataSource = wquStatistics;

       Chart.FieldName = "name";

       Chart.FieldValue = "count";

       Chart.TypeChart = PxChart.PxChart.enumTypeCharts.tcPie3D;
Picture of the resulting graph looks like this, in the example below:
If you want to load data to the PxChart component from the xml file and not from
the PxWebQuery component, you can do so by means of the ChartXML property.
In case you load the data to the PxChart component via the ChartXML property,
all properties of the PxChart component will be blocked, except for the TypeChart
property, where the chart type is defined. The picture below contains
an example of the XML file model:
       <graph caption='Statistics of genres' subCaption='A summary of genres for all CD titles'

        showPercentageInLabel='1' pieSliceDepth='25' decimalPrecision='0' showNames='1'

        pieRadius='100' >

          <set name='Pop' value='8' color='0099CC' />

          <set name='Muzikal' value='4' color='FF0000' />

          <set name='Rock' value='2' color='006F00' />

          <set name='Komédia' value='2' color='0099FF' />

       </graph>
In the <graph> section enter elements which describe more closely the resulting graph.
They are for example the following tags: Caption, Subcaption, showNames and so on.
In the <set> section enter name and value of the output graph.
The PxChart component is an encapsulation of the free FusionCharts v.2.0 component.
For more detailed description of individual elements that effect chart display and description
of output XML file creation please refer to the documentation for the FusionCharts v.2.0 components, or go to our web:
http://www.proxima-soft.sk/data/FusionChartsFree/Contents/menu.html
Others articles of Px Framework:
- PxWebQuery - component for working with databases
- PxSuperGrid - component for the direct display of data in the table
- PxEdit - component for data editing, similar to the TextBox component
- PxComboBox - component for selecting data from a list, similar to the DropDownList component
- PxCheckBox - component for checking the value (Check / UnCheck value)
- PxFlyComboBox - set of the consecutively linked comboboxes, suitable for the work with structured data (for example: selection of category and subcategory)
- PxGreatRepeater - component for entering data with repeating structure, maximum number of values is limited
- PxJSDatePicker - component for the date entry, based on the JavaScript
- PxDbNavigator - the component for the work with the PxWebQuery components, row cursor movement, etc.
- PxLabel - component for data display
- PxCheckBoxList - component to view and select values from the list
- PxRadioButtonList - component for view and selection of a value from the list
- PxChart - the component for displaying and working with charts
- PxFilterView - visual component for filtering the table data contents in the PxWebQuery component
- PxUploader - component for uploading binary and text files to the server
- PxLogin - component for authorization and logging into the application
- Data loading from the Oracle, MSSQL, MySQL, FireBird, Interbase database by means of the PxWebQuery components
- Program inserting, editing or deleting of row into the database by means of the PxWebQuery component
- Loading values from the PxWebQuery component via the while cycle
- Row search in the PxWebQuery component according to the value entered and the name of the column where the search shall be carried out
- The "ReOpen" procedure of the PxWebQuery component and data re-load into the PxWebQuery component
- Validation, checking of the entered values by means of the PxWebQuery component and other visual components (PxEdit, PxComboBox, etc.)
- Events of the PxWebQuery component
- A special function GetValueFromStructKey of the PxWebQuery component
- Setting the language mutation of the Px Framework
- Finding the current version of the Px Framework
It doesn't the intention of this part website, describe in detail the work with PxFramework components, a detailed description of the component
available in manual, which can be downloaded here:
Download manual of Px Framework


